
Download this chart with sources —>
Discuss this issue on LinkedIn —>
In March 2016 I sat with Russian gas sellers and told them American LNG was coming for their market. They pushed back, politely. The direction was right, but the magnitude was hopelessly wrong — the big driver was, of course, the coming conflict, which we had not priced in.
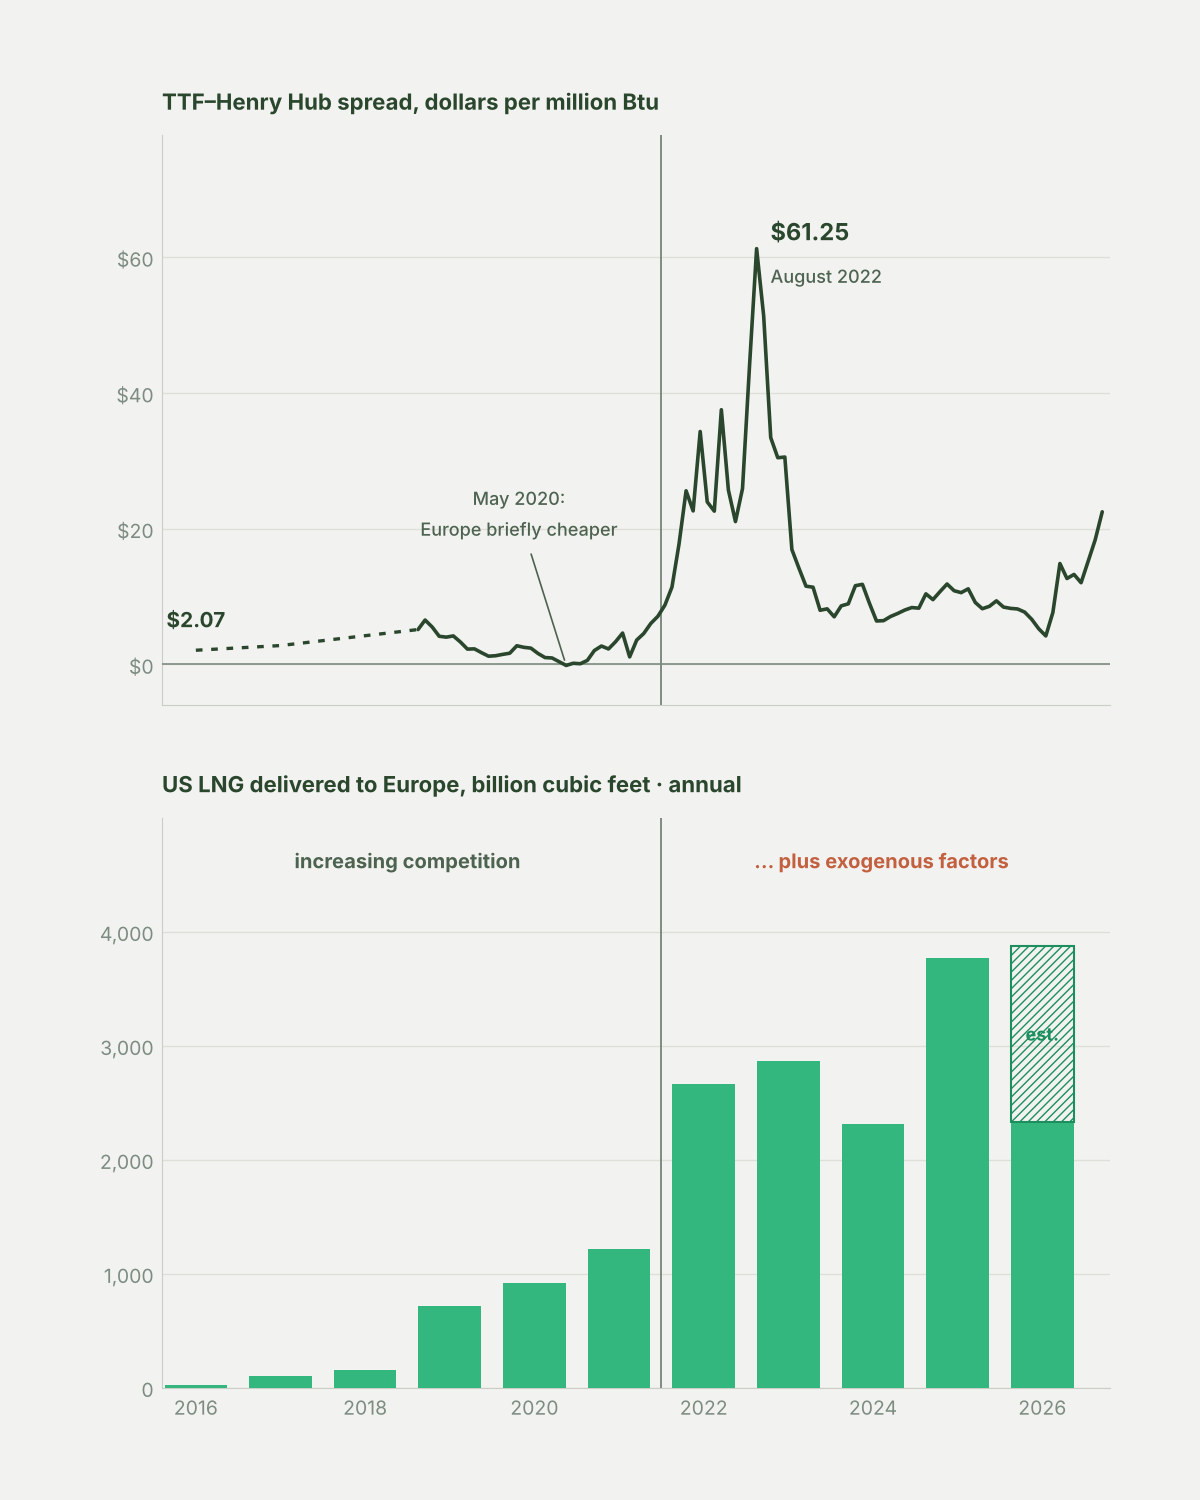
The first US LNG cargoes were always going to take some European market share, and they did — steadily, while the TTF to Henry Hub spread stayed narrow, the cost of moving the gas plus a moderate margin. A persistent gap means flows, not dysfunction. Every year Europe had more sellers and more optionality.
Then 2022 took the lid off. The spread averaged $33.97 for the year and reached $61.25 in August alone, with European gas at $70.04 against Henry Hub at $8.79. US LNG into Europe went to 2,662 billion cubic feet — one year adding more volume than the previous five put together, 1,444 against 1,200. Almost none of it was newly produced. Total US exports rose 8.6% that year while Europe’s share of them went from 34% to 69%. The gas was already sailing; the spread only changed where it landed.
What came after is the striking part. From late 2023 to the middle of this year the spread never cleared $15 — the highest month in that whole run was March 2026, at $14.85. Higher prices could not pull more cargoes across, and where they tried they destroyed the demand that justified them.
Now it’s $22 and climbing. Corpus Christi and Golden Pass add about a billion cubic feet a day next year. That chips at Europe’s problem. It does not solve it.
For the record on how far the displacement actually went: Russia was 45% of EU gas imports in 2021 and 12.5% in 2025. The thing I described in that room did happen. It did not happen for the reason I gave.
So how high does European gas go this winter?
Method
Prices. World Bank Commodity Price Data, the monthly “Pink Sheet”, in dollars per million Btu. The Bank names the two rows “Natural gas, Europe” and “Natural gas, U.S.” and defines them in the same sheet as Netherlands TTF and Henry Hub spot, Louisiana. Monthly figures run from August 2018 to September 2026; every complete year in that window reproduces the Bank’s own printed annual average to the cent, which is the check used to catch transcription errors.
Why the line is dotted before 2018. The Bank redefined its European series in September 2018, from “average import border price with a component of spot price, including UK” to Netherlands TTF. It blanked the row for two editions, restated the history, and resumed in November 2018 — without renaming the series. The proof is that 2015 reads 7.26 in the June 2017 edition and 6.82 in the December 2018 one. Because each edition prints only three monthly columns, no post-switch edition ever republished restated monthly figures reaching back past August 2018. The restated annual figures for 2016 and 2017 do exist, so those two years are plotted as annual points on the same TTF basis. The resolution changes; the definition does not.
Volumes. US Department of Energy, Natural Gas Imports and Exports Monthly, and the LNG Annual Reports. Europe follows DOE’s UN M49 grouping, which includes Türkiye and the United Kingdom. 2021 through 2025 are DOE’s printed annual region figures. 2016 is a direct country sum from the 2016 LNG Annual Report: Türkiye 8.76, Portugal 3.70, Italy 3.33 and Spain 2.93, totalling 18.72 Bcf across six cargoes — the Portugal row is the Sines cargo. 2017 through 2020 are differences of DOE’s cumulative region tables, because DOE published only cumulative totals in those years; the method reproduces DOE’s own printed 2021 figure to 0.1 Bcf.
A note on what “Europe” means. EIA uses EU-27 plus the UK in some articles and the M49 basis in others, which is why it has published both 64% and 69% for Europe’s share of 2022 US LNG exports. Both are correct. Türkiye took 192.1 Bcf that year. This chart uses DOE’s M49 Europe throughout.
The 2026 bar. Eight months measured — 2,332.8 Bcf to Europe through August, of 4,201.0 Bcf total. The hatched remainder is EIA’s own Short-Term Energy Outlook forecast of 17.6 Bcf/d for 2026, which implies 2,223 Bcf across September to December, with Europe taking the 69.1% share it took over the same months of 2025. That gives 3,869 Bcf for the year. It is one assumption, stated, and anyone who expects Asia and Africa to keep those cargoes should argue with the assumption rather than the arithmetic — in the first eight months of 2026 Europe’s share of US exports fell from 68.0% to 55.5% while Asia rose 87% and Africa 86%.
What is not here. European gas storage levels, which would have supported the argument, are not cited: GIE AGSI publishes no reuse grant, the European Commission’s storage page is a year stale, and the only current figure sits inside an ACER report whose legal notice bars redistribution. Russian and US shares of EU gas imports are not charted for the same reason — the Commission only began publishing annual shares on a stable basis in 2024, and Eurostat’s gross-imports denominator does not reconcile with the Commission’s physical-flow basis. The two Commission figures quoted above (45% in 2021, 12.5% in 2025) are clean. On that 12.5%: the Commission’s own Q4 2025 report says “around 13%” in its highlights and 12.5% in section 1.3. The lower figure is used here.
Sources
Every figure here is from a free, public, licence-clean source. No price assessment from any price reporting agency is cited or charted.
World Bank Commodity Price Data, monthly Pink Sheet editions, April 2016 through October 2026.
US Department of Energy, Natural Gas Imports and Exports Monthly, August 2026 edition, released 22 October 2026.
US Department of Energy, LNG Annual Report 2016.
US Energy Information Administration, Henry Hub natural gas spot price, monthly.
US Energy Information Administration, Short-Term Energy Outlook, October 2026.
European Commission, Quarterly Report on European Gas Markets, Q4 2024 and Q4 2025.
PRICED IN is published weekly by Real Heritage Group. What goes into a price — and what comes out of it.