
Download this chart with sources —>
Discuss this issue on LinkedIn —>
The US grid averages about 0.35 tonnes of CO2e a megawatt-hour. Data centers pull both ways from it — they buy more clean power than any other industry, which argues cleaner, and they are almost pure new load, which gets served at the margin and argues dirtier. If you think one of those wins, say so. I have not been able to settle it.
I built first-generation carbon price assessments and turned them into something a buyer of carbon-neutral energy could act on. The work included deciding which tonnes went into the average and which did not — a debate still active today.
Let’s give credit where it is due. These buyers built the engineered removal industry by paying for it before there was a market — Microsoft alone accounts for about 80% of every engineered tonne ever contracted — and four of them jointly committed to twenty million tonnes of nature-based removals nobody required them to buy.
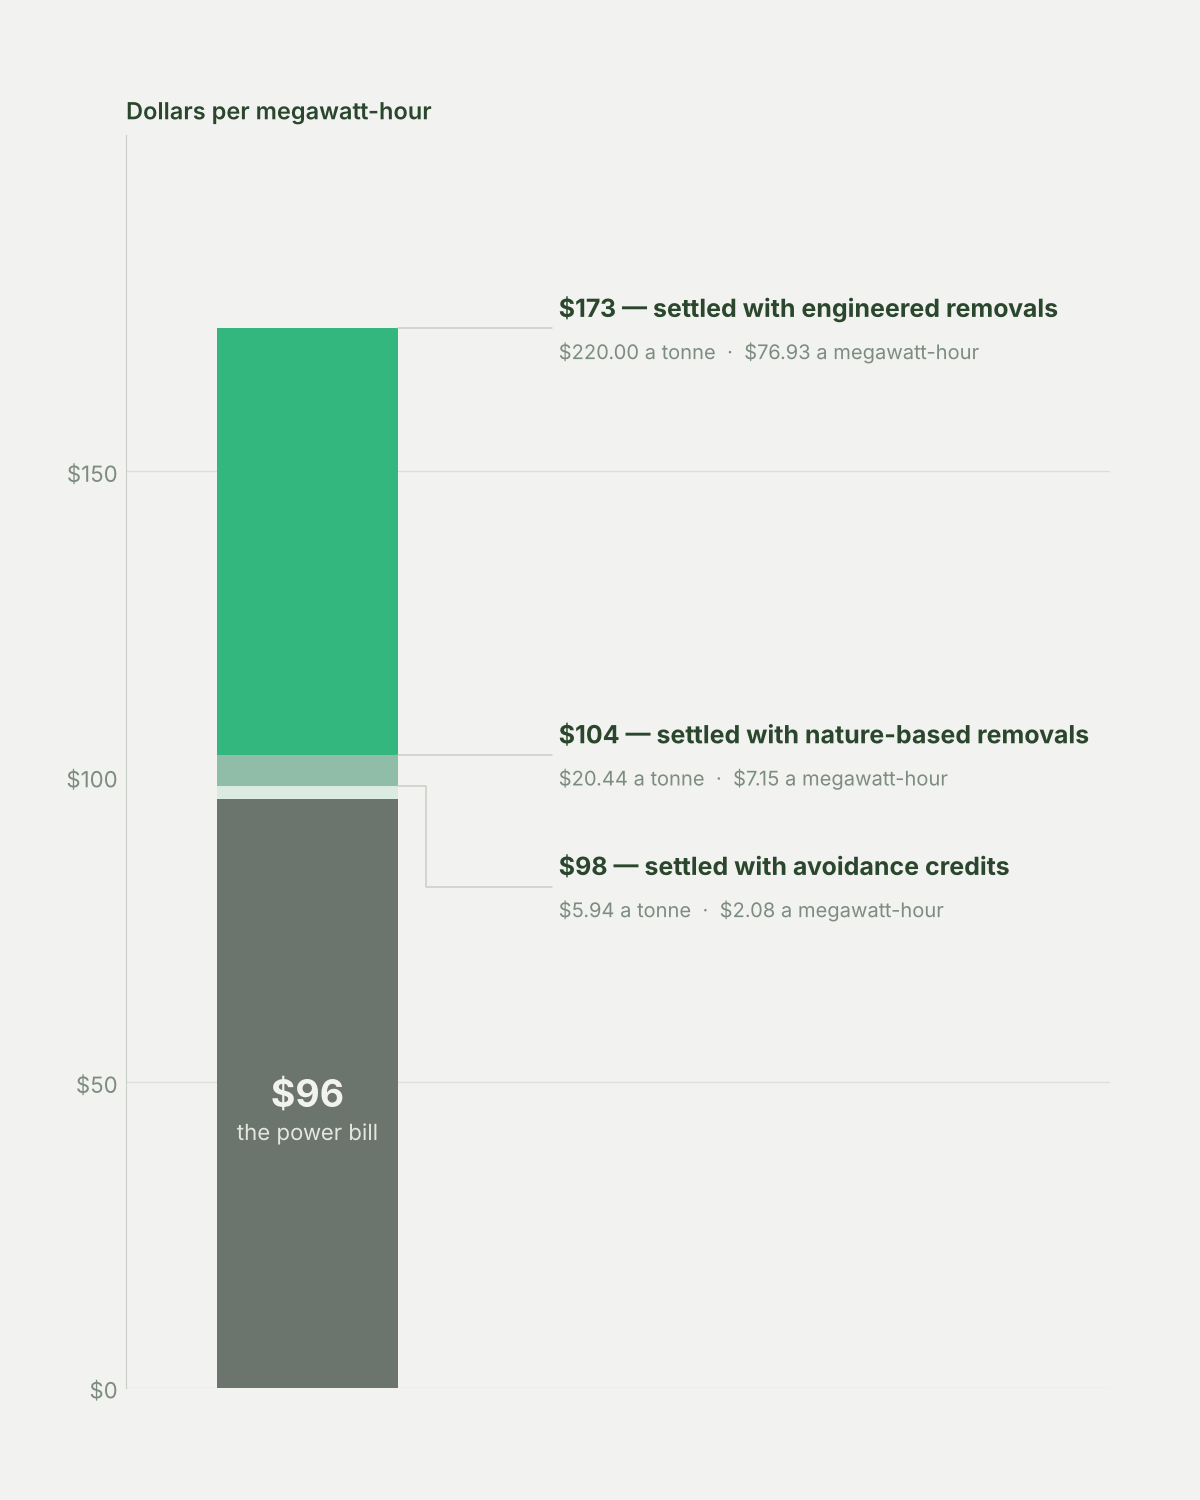
Settled with avoidance credits at $5.94 a tonne — the transacted average once renewable energy credits are stripped out, because nobody serious is settling Scope 2 with those any more — a megawatt-hour’s carbon costs $2.08. With nature-based removals at $20.44, $7.15. With engineered removals at $220, $76.93. The power itself runs about $96.
The three are not quite interchangeable, though nothing explicitly stops a buyer using the cheapest column for Scope 2. Engineered tonnes are easier to count and easier to defend on paper, and the market has delivered 1.7 million of them against 50.6 million contracted. $220 is weighted by what buyers have contracted, which is mostly BECCS; weight it by what has actually been delivered, mostly biochar, and it is $165. The full range runs from about $140 to about $1,200 for high-end direct air capture. At the expensive end, the carbon costs more than the megawatt-hour itself.
Full disclosure: I sell two of these three. If the middle road strikes you as fantastically pragmatic, consider the source.
Method
Carbon intensity, 0.35 tonnes CO2e per megawatt-hour. EPA eGRID2023 (revision 2, June 2025), US total output emission rate, 770.9 lb CO2e/MWh. This is the national grid average at generation, used here as a proxy. It is a deliberate middle: it ignores both the clean power these buyers procure, which would push it down, and the marginal rate at which new load is actually served, which would push it up. eGRID’s non-baseload rate is 0.62 tonnes. Add roughly 5% if you want emissions per megawatt-hour consumed rather than generated. eGRID2023 carries 2023 data, so it is likely a little high for 2026.
A note on what this replaced. An earlier draft of this post used 545 grams per kilowatt-hour from a June 2026 preprint claiming hyperscale sites run about 48% dirtier than the national average. That figure did not survive checking. It exceeds every eGRID subregion that hosts hyperscale load — the dirtiest is MRO West at 417 grams, and an average cannot exceed its own maximum. It cannot be reconciled with the paper’s own reported fuel mix of 38% gas and 15% coal; reaching 545 would require gas running dirtier than coal. And Northern Virginia, the largest cluster on earth, sits in eGRID’s SERC Virginia/Carolina subregion at 269 grams, about 23% below the national average, so the paper’s geographic explanation runs backwards. No independent source puts US data center grid intensity meaningfully above the national average.
Avoidance credits, $5.94 a tonne. Ecosystem Marketplace, State of the Voluntary Carbon Market 2025, covering 2024 transactions. The published all-reductions figure is $4.05, but it includes renewable-energy carbon credits at $2.67, which few credible buyers would now use to settle Scope 2. Renewable energy is pure avoidance with no removal component, so its volume and value subtract cleanly from the reductions bucket: 38.8 Mt and $157.5m less 22.3 Mt and $59.5m leaves 16.5 Mt and $98.0m, or $5.94 a tonne. Cross-check from the other direction: the five non-land, non-agriculture categories total 16.4 Mt and $92.7m, or $5.65. The range is $5.65 to $5.94.
Worth knowing: pure avoidance is mostly industrial gas, landfill gas and cookstoves, not forest credits. Ecosystem Marketplace places “some ARR, IFM, and REDD+ projects” in a separate both-reductions-and-removals bucket, so most forest volume is not in pure reductions at all.
Nature-based removals, $20.44 a tonne. Same source, afforestation, reforestation and revegetation, 2024 transacted average. ARR rather than improved forest management, because IFM credits mix removals with avoided emissions and so are not a clean removal price.
Engineered removals, $220 a tonne. Weighted by contracted volume, which is roughly 75% BECCS. The observed tonnage-weighted transaction median for BECCS is about $214 (Holler and Reichelstein, 2026). Contracted-basis constructions run $215 to $297; $220 is the low end. Weighting instead by delivered volume, which is roughly 86% biochar, gives $165. Contracted is the right basis here because a buyer settling a future obligation is committing forward, and because it matches the transacted basis of the two other columns. Floor and ceiling: Nasdaq Copenhagen’s CORCX index of near-dated Puro registry transactions is $149; direct air capture runs $500 to $1,200.
Power, $96.40 a megawatt-hour. EIA, average retail price to industrial customers, August 2026, at 9.64 cents per kilowatt-hour. EIA does not collect rates; it divides reported revenue by reported sales, so this is a proxy for price. Industrial is the cheapest customer class — the all-sector average was 14.87 cents and residential 18.16 — so this is a conservative denominator. No free source publishes what a hyperscaler actually pays; those contracts are confidential. EIA’s wholesale energy-only figure across eleven hubs is $52 a megawatt-hour, which would roughly double carbon’s share of the bill.
Known mismatch. The engineered price is September 2026. The avoidance and nature-based prices are 2024 transactions, because no free 2026 edition of the Ecosystem Marketplace survey exists.
Sources
Every figure here is from a free, public, licence-clean source. No licensed price assessments are cited or charted.
EPA eGRID2023, revision 2, June 2025 — US total output emission rate, Table 1, 770.9 lb CO2e per MWh.
EIA Electricity Monthly Update, August 2026 data, released 23 October 2026 — average retail price to industrial customers.
Forest Trends’ Ecosystem Marketplace, State of the Voluntary Carbon Market 2025 — Table 3 at p. 13, Table 4 at p. 14, Table 7 at p. 23.
Nasdaq Copenhagen CORC indices via Puro.earth — CORCX composite and CORCCHAR biochar, September 2026 reporting period, published 7 October 2026.
Holler and Reichelstein, Cost Comparisons for Emerging Carbon Dioxide Removal Technologies, 2026 — observed tonnage-weighted transaction medians.
World Economic Forum, Carbon Dioxide Removal Technologies, March 2026 — direct air capture price range.
cdr.fyi — contracted and delivered volumes by method, accessed 29 October 2026.
ECB euro reference rate, 28 October 2026, for the CORCX conversion at 1.1133.
PRICED IN is published weekly by Real Heritage Group. What goes into a price — and what comes out of it.