
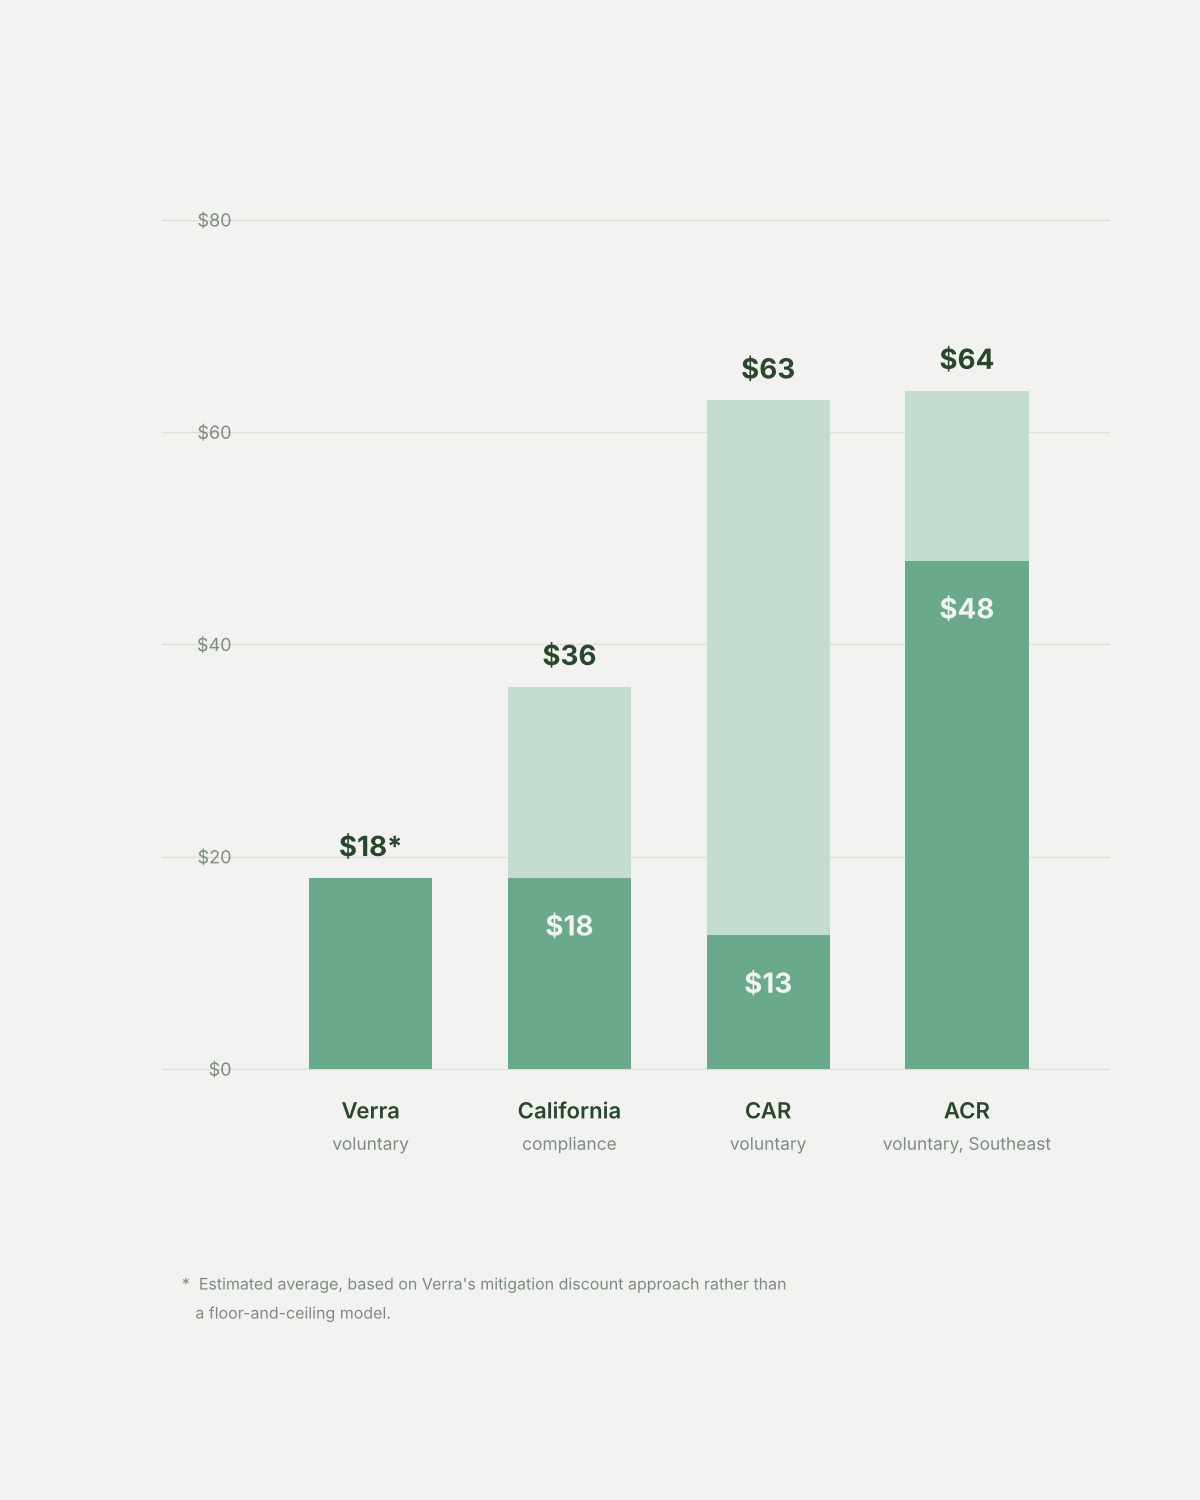
The wildfire buffer on carbon projects ranges $13-64/acre, depending on the rulebook
Download this chart with sources —>
Discuss this issue on LinkedIn —>
Every US forest carbon project holds back part of the credits it earns, in case the forest burns. It is a necessary mechanism. A project that loses its carbon should have cover, and withholding credits is straightforward.
The unit is simple. One percentage point of buffer is one credit in every hundred. At $15 a credit — roughly the 2024 average for improved forest management — that is 15 cents a credit. Run it over a 20-year crediting period on a stand yielding 3 credits an acre a year and a point costs $9 an acre.
Applying that to the same Southeastern forest across four programs:
Verra costs about $18 an acre. California's compliance program, $18 or $36. The Climate Action Reserve, $13 to $63. ACR, $48 to $64.
Every program discounts the charge for documented fire work. None of them agrees what that work is worth: $16 an acre under ACR, $18 under California, $50 under CAR.
All of this is done in good faith. These were reasonable rules when written and have not been reopened.
Whether any of them tracks where fire actually happens is a separate question. So is whether a thinner buffer makes a lower value credit.
I develop ACR forest projects, so weigh that accordingly.
Method
Dollars an acre over a 20-year crediting period, at $15 a credit and 3 gross credits per acre per year. The price is rounded from $14.97, the 2024 transacted average for improved forest management reported by Forest Trends' Ecosystem Marketplace — a global, self-reported, voluntary market figure. It is applied across all four columns including California, whose compliance credits trade at a premium to voluntary forest credits, so the California bar is conservative. No licence-clean public price series for California offset credits exists.
The yield is the weakest input. Public sources give 1.6 credits per acre per year (ACR801, Arkansas, first issuance annualised) and 4.2 (ACR783, Arkansas, a 20-year projection in a press release). At 1.6 every figure falls by 47% and at 4.2 rises by 40%, while the proportions within and between bars are unchanged.
ACR's 7.1% is the burnable-weighted rate implied by the Wildfire Hazard Potential class mix across Alabama, Georgia, Mississippi, North and South Carolina, Louisiana and Arkansas, which ranges from 5.75% in Arkansas to 8.17% in Georgia. It is a state-level proxy: ACR weights the raster inside the project boundary, so a particular tract will differ. Its discount is the 25% reduction for treatment postdating the raster.
California's two rates turn on documentation rather than geography — 2% where fire risk reduction work across the entire project area is confirmed in writing by the responsible fire protection agency, 4% where it is not.
CAR's protocol carries no number at all. It points to the Assessment Area Data File, where the value is 0.07 in every one of its 361 assessment areas. Its discount is a multiplier of 20% where an approved vegetation plan is implemented across at least 80% of the intended area.
Verra is drawn as a single value because its figure is what projects pay in practice rather than a published rate, and its mitigation discount cannot be separated into a floor and a ceiling. Its risk categories are also additive, where the three US programs combine multiplicatively — so the bars are comparable in magnitude but not identical in arithmetic.
Sources
Every figure here is from a free, public, licence-clean source. No licensed price assessments are cited or charted. Page numbers are given as printed, with the PDF page in brackets where they differ.
American Carbon Registry, Tool for Reversal Risk Analysis and Buffer Pool Contribution Determination v2.0, November 2024 — Table 5 at p. 15, the 4% floor and 25% mitigation discount at p. 16, and §3.4 at p. 14. https://acrcarbon.org/wp-content/uploads/2016/01/ACR-Risk-Tool-v2.0-2024-11-19.pdf
California Air Resources Board, Compliance Offset Protocol U.S. Forest Projects, adopted 25 June 2015 — Table D.7 at printed p. 135 [PDF p. 140]. https://ww2.arb.ca.gov/sites/default/files/cap-and-trade/protocols/usforest/forestprotocol2015.pdf
Climate Action Reserve, U.S. Forest Protocol V5.1, 20 July 2023 — Table A.8 at printed p. 134 [PDF p. 138], Table A.9 at printed p. 135 [PDF p. 139]. https://climateactionreserve.org/wp-content/uploads/2023/07/Final_Forest_Protocol_V5.1_7.14.2023.pdf
Climate Action Reserve, Assessment Area Data File Batch 2.2, 16 October 2019 — sheet Supersections_stats, column "Wildfire, Disease, or Insect Outbreak Risk". https://climateactionreserve.org/wp-content/uploads/2019/10/Assessment-Area-Data-File-Batch-2.2.xlsx
Verra, Procedure for Applying the AFOLU Non-Permanence Risk Tool v5.0, 16 December 2025 — Tables 10 and 11 at printed pp. 20-21. https://verra.org/wp-content/uploads/2025/12/Procedure-for-Applying-the-AFOLU-Non-Permanence-Risk-Tool-v5.0.pdf
USDA Forest Service, Wildfire Hazard Potential for the United States, 2023, 4th edition, RDS-2015-0047-4 (Dillon) — state summary, used for the class mix. https://research.fs.usda.gov/firelab/products/dataandtools/wildfire-hazard-potential
Forest Trends' Ecosystem Marketplace, State of the Voluntary Carbon Market 2025 — improved forest management transacted average, $14.97/tCO2e for 2024.
PRICED IN is published weekly by Real Heritage Group. What goes into a price — and what comes out of it.