
Download this chart with sources —>
Discuss this issue on LinkedIn —>
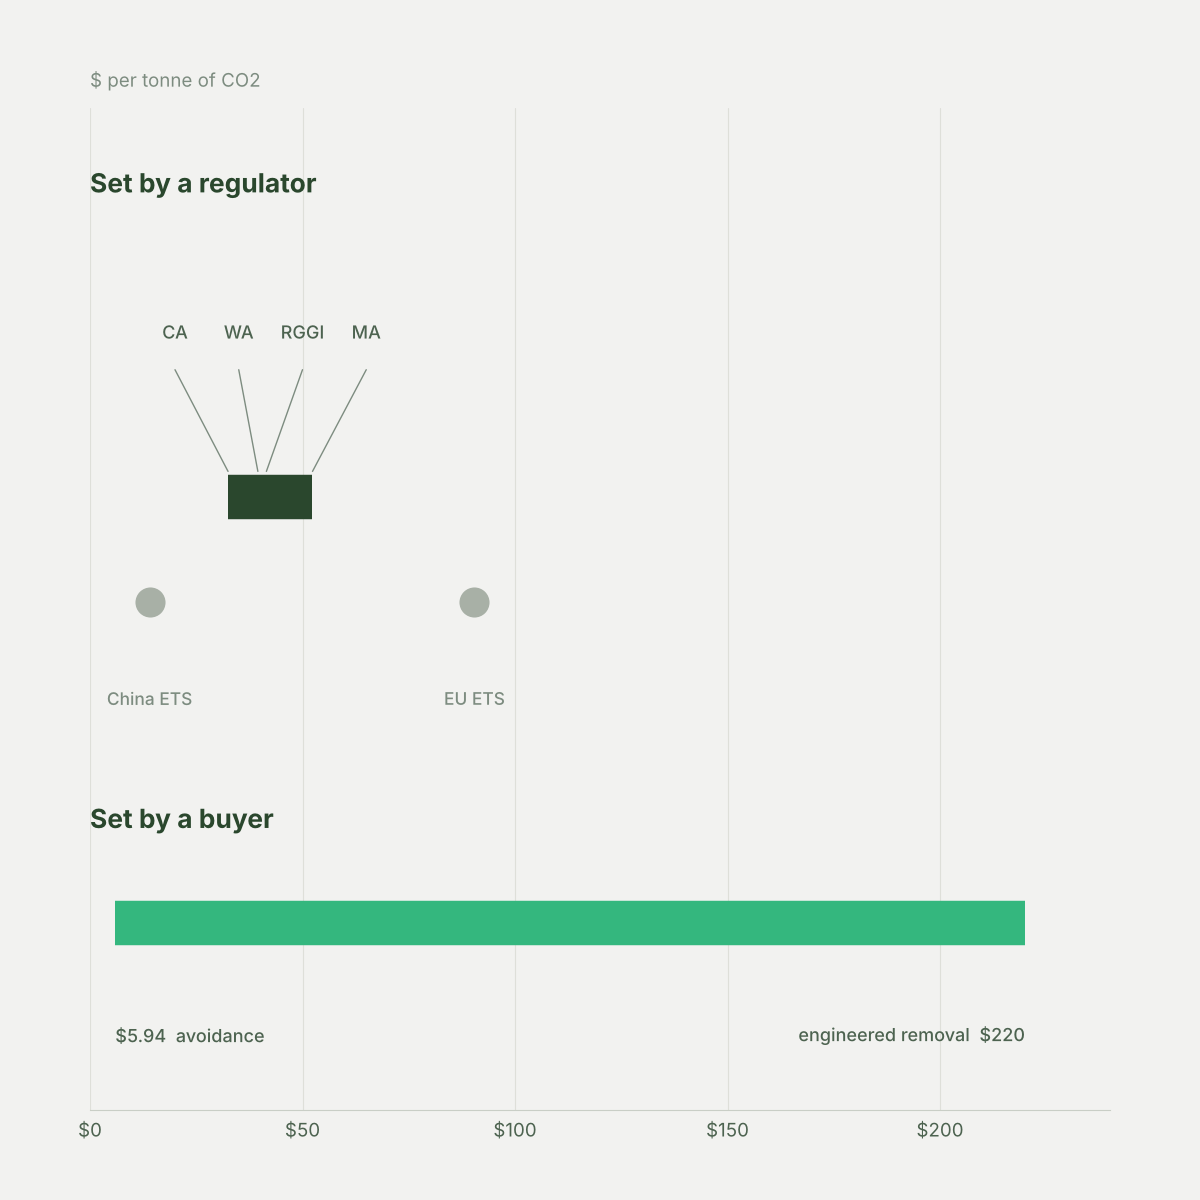
A tonne of carbon out of a US power plant has a lot of different prices, depending on who sets it.
About ten percent comes from a plant in a state with a carbon program — California, Washington, and the eleven RGGI states. Those prices are set at auction, published, and sit between $32 and $42. Massachusetts stacks a state rule on RGGI, taking it to $52. That is the only place on this chart where one tonne pays twice: 310 CMR 7.74 sits on top of the RGGI allowance rather than replacing it.
The other ninety percent isn't in a program. That doesn't make the carbon free. Most of that power goes to companies with their own targets, and they are all buying something.
They start the same way, buying cleaner power so there's less to account for. Then they split. Microsoft has gone almost entirely to engineered removal, Amazon leans nature-based. What they pay isn't public — Microsoft charges itself an internal fee per tonne and hasn't published the rate since 2019, Google and Amazon publish none, and Meta ran one in 2024 and dropped it. There is no obligation to disclose and no standard format if they wanted to.
Outside the US a regulator still does it. The EU is near $90, China near $14. China's program covers more tonnes than the EU's; it caps carbon intensity rather than total emissions and allocates allowances free against a benchmark, which is most of why the price sits where it does.
None of these are the same instrument. An allowance is permission to emit a tonne. A credit is a claim that a tonne went somewhere else. China caps intensity, not total emissions, and RGGI and the EU cover different sectors under different caps. One axis, no exchange rate.
So which one is the price of a tonne?
Method
The share. US electric-power CO2 emitted in a state inside a carbon program, 142.8 million tonnes of 1,421.7, from EIA's State Energy Data System Table CO2.6 — both legs from the same table, so the ratio is internally consistent. What this does not do is subtract covered tonnes from the national total, which would be the more natural construction and is not defensible: California and Washington price imported power while EIA books emissions to the generating state, Massachusetts double-counts tonnes already inside RGGI, RGGI's 25 MW threshold is not EIA's sector boundary, and California's absolute covered emissions are published only in a spreadsheet format this build could not parse. Ten percent is a state-of-location figure and nothing more.
The regulator band. California-Quebec $32.48, Joint Auction #48, 19 August 2026. Washington $39.50, Department of Ecology auction, 2 September 2026. RGGI $41.50, September 2026 auction, converted from $37.65 per short ton — RGGI is the only program here that does not trade in metric tonnes, and leaving it unconverted makes it look cheaper than Washington when it is dearer. The top of the band, $52.35, is a Massachusetts tonne: RGGI plus 310 CMR 7.74 at $10.85, which stacks rather than substitutes.
The two foreign programs. China CNY 93.55 on 13 November 2026, EU EUR 82.32 — the European Commission's CBAM certificate price for Q3 2026, which is defined in law as the weighted average of EU ETS auction clearing prices and is therefore an official figure rather than an assessment. Both converted at spot.
The buyer band, low end. $5.94 is not a published figure. Ecosystem Marketplace reports project category and the reduction/removal classification in orthogonal tables and nothing crosses the two, so reduction categories cannot be volume-weighted directly. Renewable energy is pure avoidance with no removal component, so its volume and value sit entirely inside the reductions bucket and can be subtracted: reductions 38.8 Mt and $157.5M, less renewable energy 22.3 Mt and $59.5M, leaves 16.5 Mt and $98.0M, or $5.94 a tonne. Coming at it from the other direction — summing the five non-land-use, non-agriculture categories — gives 16.4 Mt and $92.7M, or $5.65. The volumes match almost exactly. The range is $5.65 to $5.94 and the subtraction figure is used.
The buyer band, high end. $220 is engineered removal weighted by contracted tonnes, which are roughly 75% BECCS. That weighting gives a band of $215 to $297 and $220 is its low end. Weighting by delivered tonnes instead gives about $165, but delivered volume is roughly 86% biochar, so that is really just a biochar price. Contracted is the right basis here because a buyer settling a future obligation is committing forward, and because it matches the transacted basis of the avoidance figure at the other end. Holler and Reichelstein put the observed tonnage-weighted BECCS transaction median at about $214.
Vintages differ and are not reconciled. The regulator prices are from August through November 2026. The avoidance figure is 2024 transacted, the most recent year Ecosystem Marketplace has published. The chart carries no single as-of date for that reason.
What is not claimed. Nothing here says the ninety percent should be priced by a regulator, or that any of these numbers is the right one. An allowance and a credit are different instruments and the chart puts them on one axis to show the spread, not to propose an exchange rate between them.
Sources
Every figure here is from a free, public source. No price assessment from any price reporting agency is cited or charted.
California Air Resources Board and Quebec MDDELCC, Joint Auction #48 summary results, 19 August 2026.
Washington Department of Ecology, Cap-and-Invest auction results, 2 September 2026.
RGGI Inc., auction results, September 2026.
Massachusetts Department of Environmental Protection, 310 CMR 7.74, allowance price effective 16 September 2026.
Shanghai Environment and Energy Exchange, national carbon market daily settlement, 13 November 2026.
European Commission, CBAM certificate price for the third quarter of 2026, published 5 October 2026.
US Energy Information Administration, State Energy Data System, Table CO2.6.
Forest Trends' Ecosystem Marketplace, State of the Voluntary Carbon Market 2025, Tables 3 and 7.
Holler and Reichelstein, comparative carbon removal cost study, 2026.
Nasdaq Copenhagen CORC indices via Puro.earth.
PRICED IN is published weekly by Real Heritage Group. What goes into a price — and what comes out of it.